Illustration examples on the following topics:
1. Illustrations for successful medical publications, patient information, presentations, medical therapy, textbooks
Medical illustrations are always helpful and necessary, whether you are studying, working in medical research or as a practicing doctor, writing publications or wanting to provide patients with relevant materials during treatment.
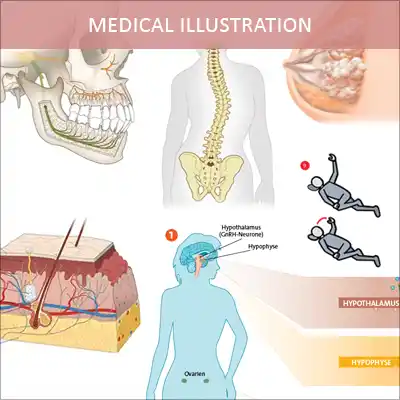
Illustration for medical publications, patient information, presentations, medical therapy and textbooks
2. Scientific illustration with focus on natural sciences
Especially science comes alive with pictures. Here you will find that not only the natural sciences like biology, geology and physics can be easily illustrated, but also economical, historical or psychological sciences as well.
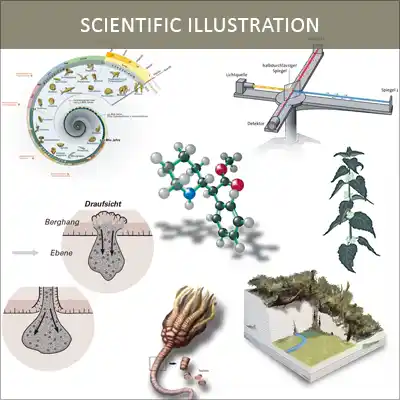
Scientific illustration
3. Technical illustration: Technic displayed descriptive and easily understood
For better understanding, technical relations and details can be depicted in segments, displaying exploded, isometric or schematic views. Here you will also find solutions for the presentation of XML-based illustrations (SVG).
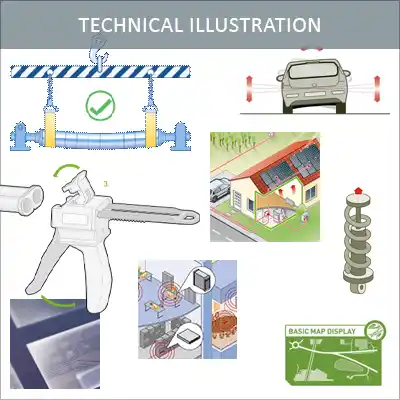
Technical illustration
4. Easy to understand images for textbooks – to make learning fun
Knowledge comprehensible for any age in textbooks, training documents and presentations. The importance of well-drawn and appealing illustrations in educational material is all know from our early school years. But also materials for higher education need pictures which are easily understandable and fun to look at.
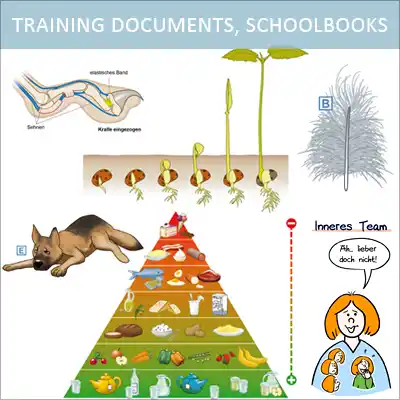
Knowledge comprehensible for any age in
textbooks, training documents and presentations
5. Creation of CI-compliant charts and easy to understand diagrams
Numbers, dates and facts – the “classics” of infographics. We have all seen an infinite number of bar and pie charts, but these must to be appealing to the eye and, more so, need to display data in a way specific to the topic as well as the target group.
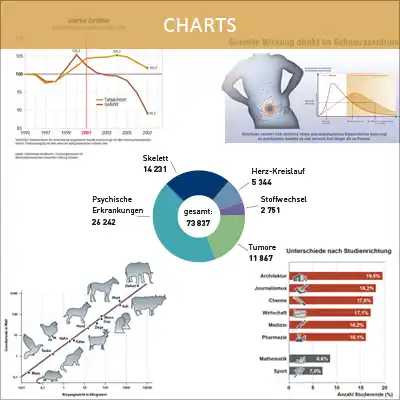
Numbers and data visualised in CI-compliant pictures:
From pie chart to complex content
6. Memorable and comprehensible symbols: Logos, pictograms, icons and vignettes
An idea or concept displayed in a simplified manner through logos, vignettes, pictograms and icons. This aids us in capturing the idea as well as recognition and orientation.
Illustration of memorable and comprehensible symbols:
Logos, pictograms, icons and vignettes
7. Historical, geoscientific or sociological topics displayed on maps
Maps and themed maps offer a myriad of ways to display information. Context and chronology are easily understandable.
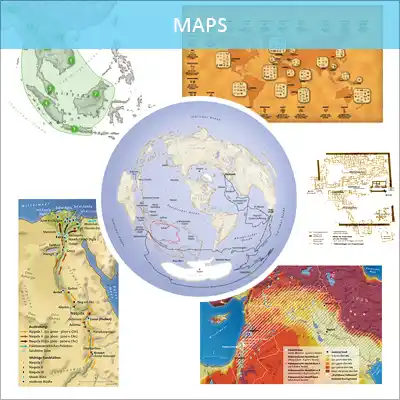
Historical, geoscientific, sociological topics displayed on maps
8. Design, conception and programming for interactive infographics: make data efficient, instructive and fun
Infographics are all the more efficient when the viewer can interact with them. Interactive graphics created in HTML5 or vector data created and tagged in SVG can be integrated into websites, animated or used in presentations. Facts can also be created in a user-friendly way using animated educational clips.
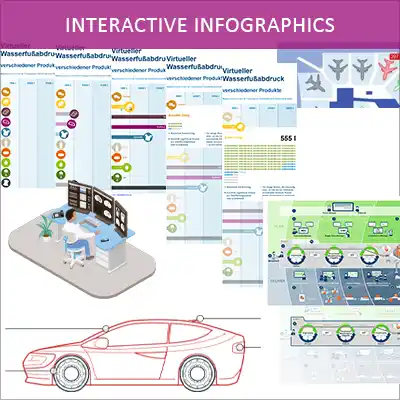
Illustration, conception and programming of interactive infographics
9. Animation and educational films
Facts and training content can be presented in a didactically appealing way using animated educational films, making learning fun.
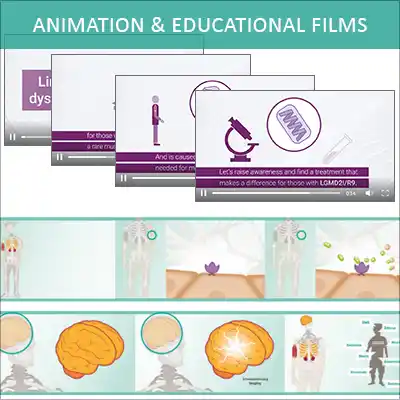
Illustration and concept of animations and educational-films
